Generating Data
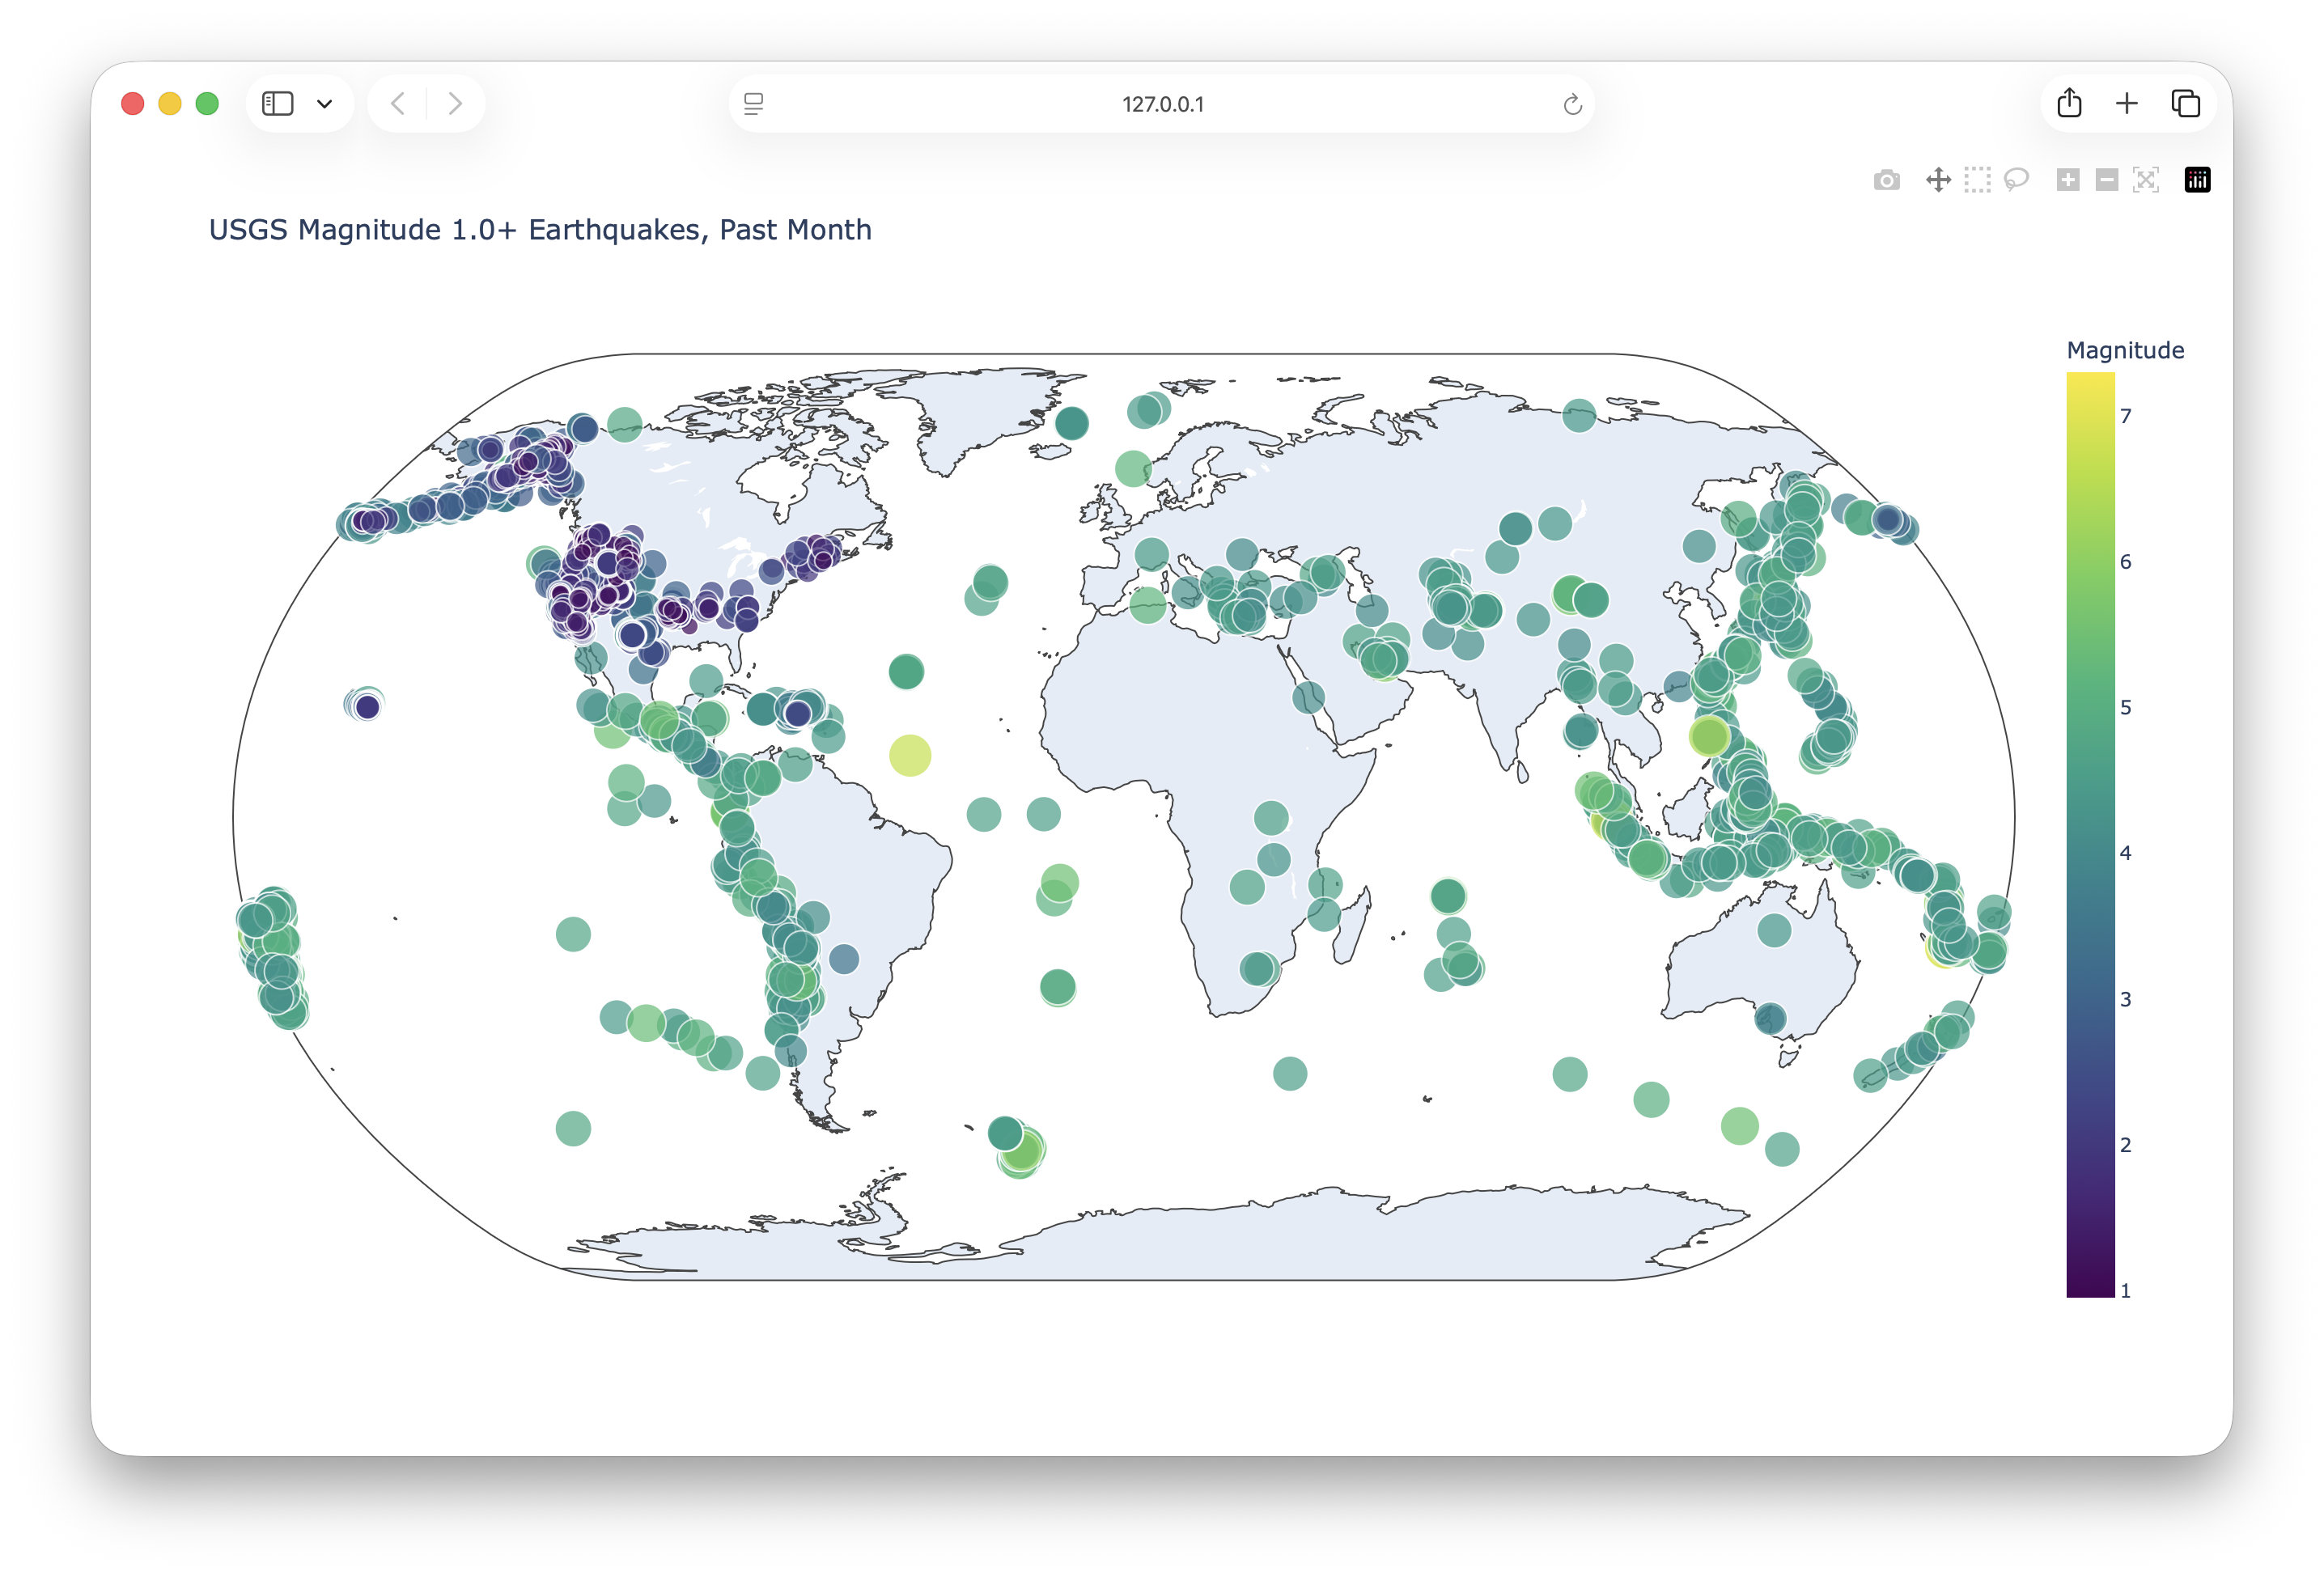
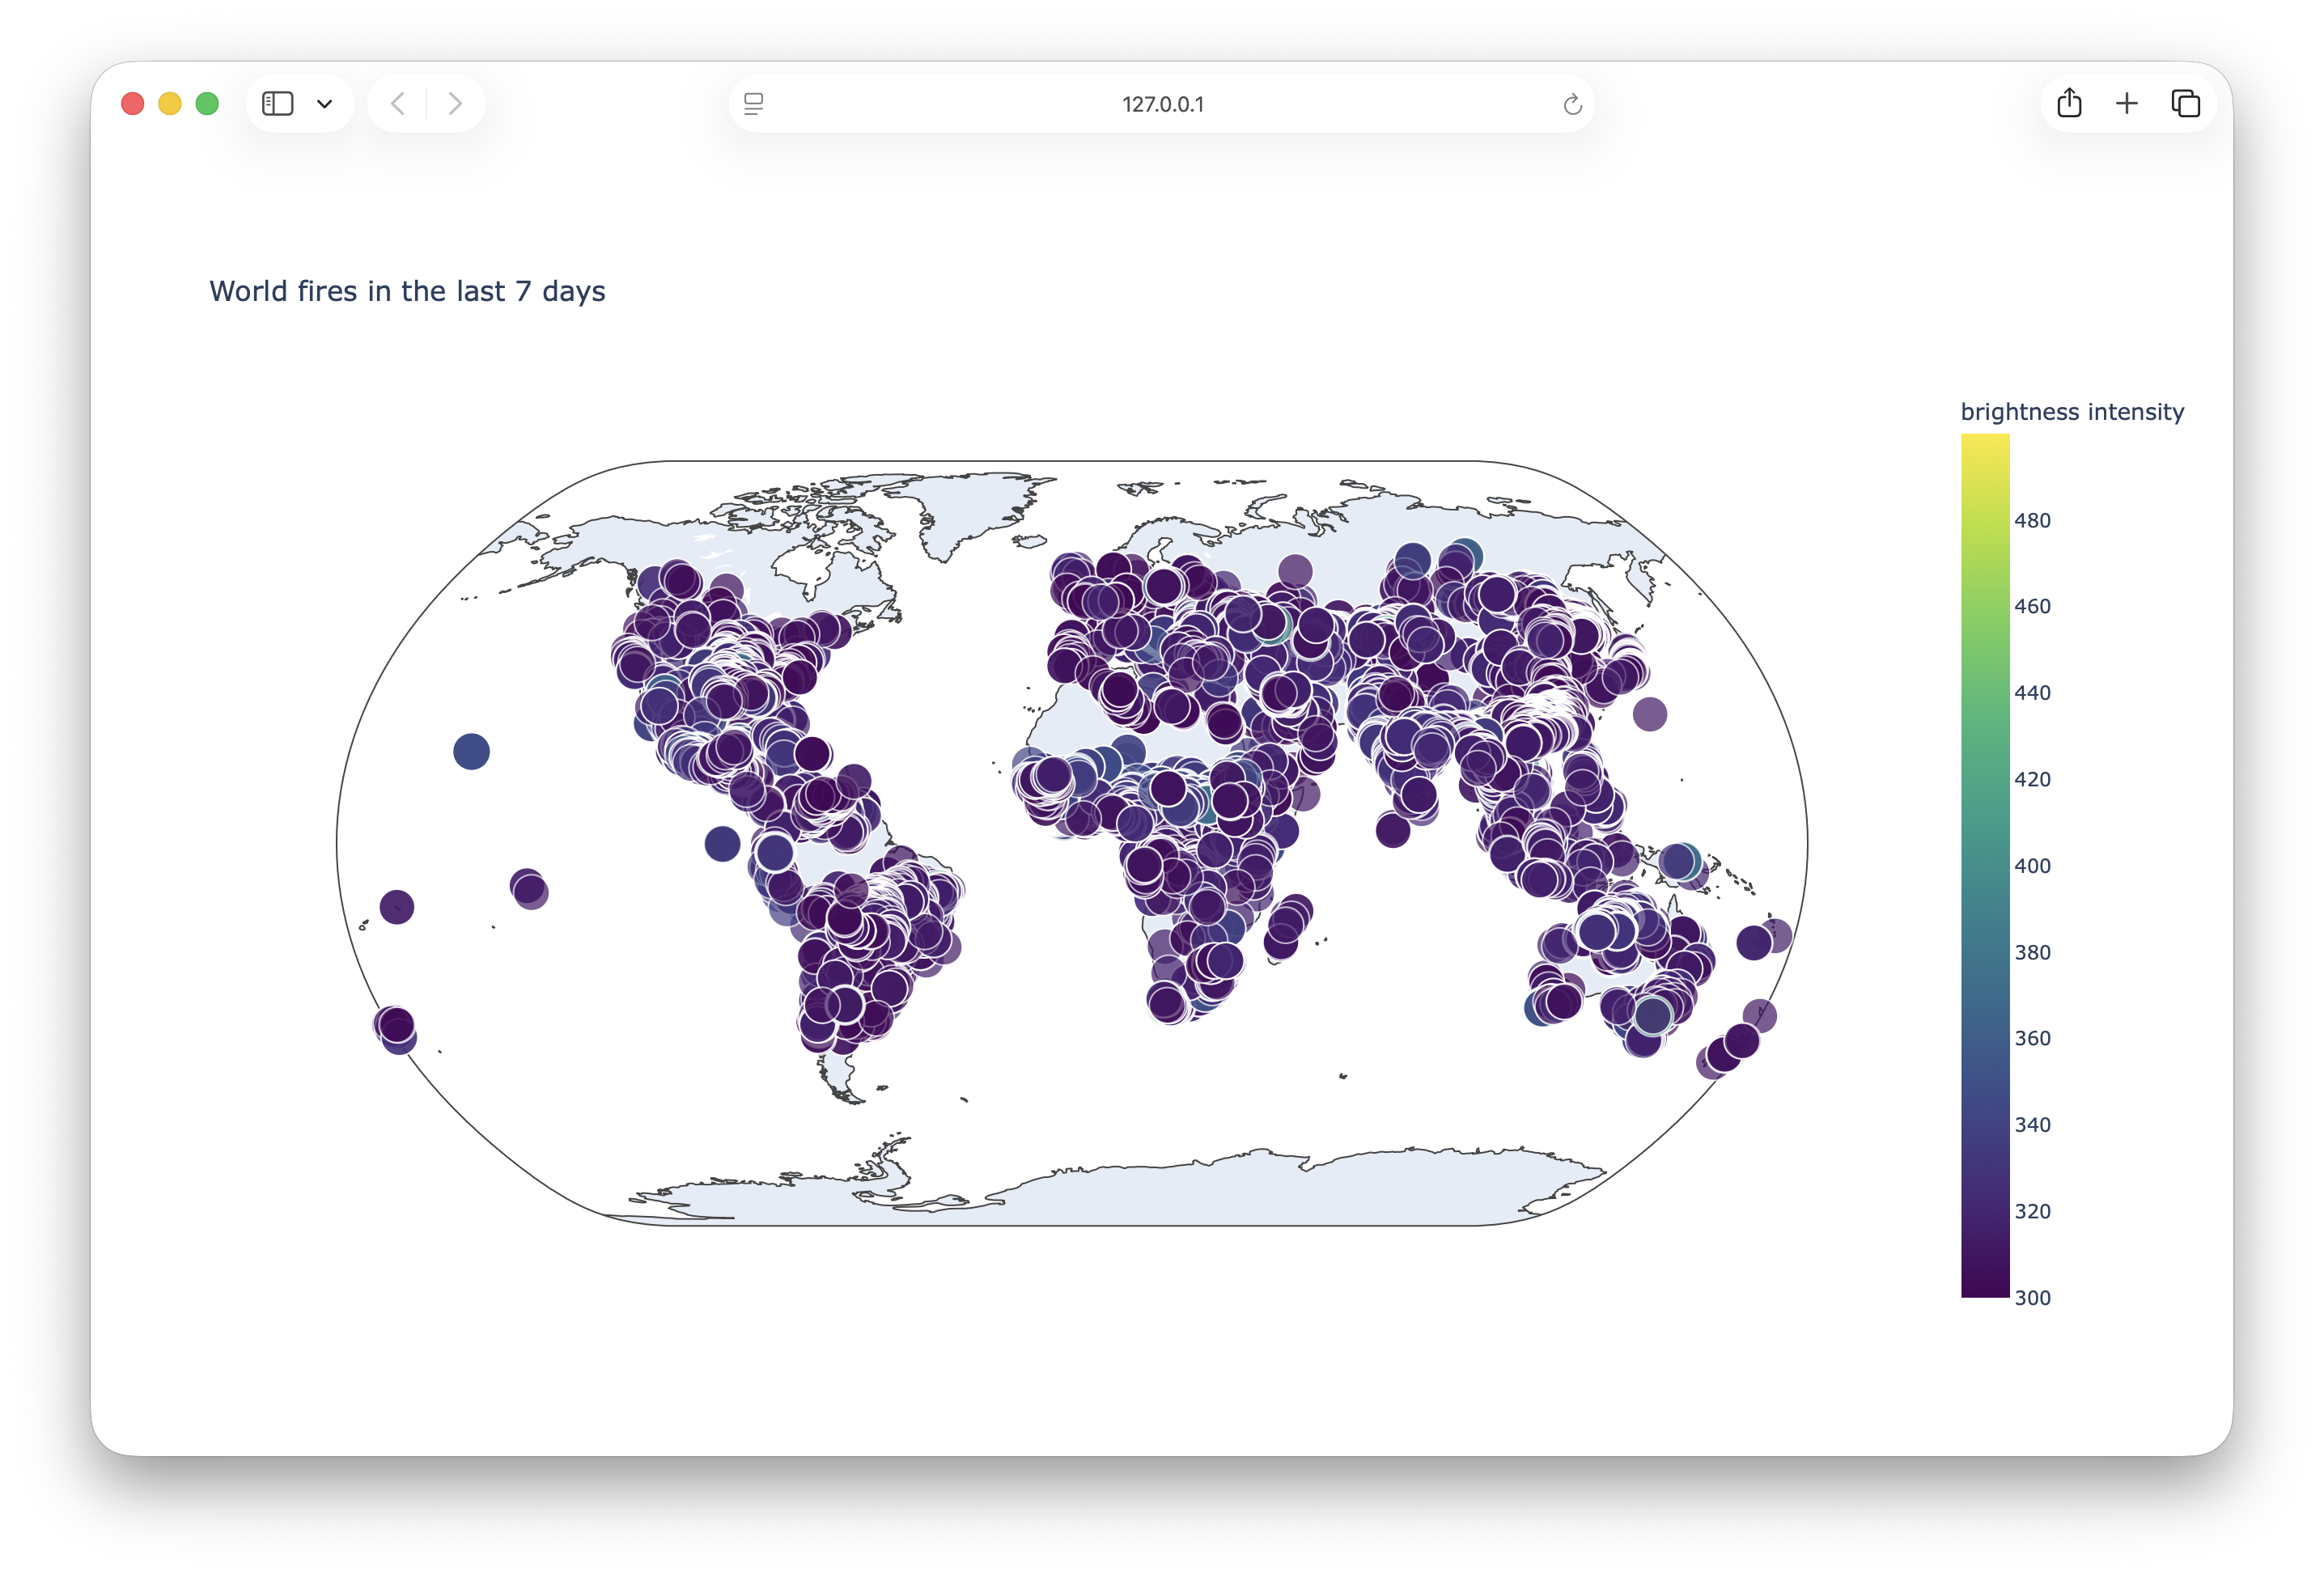
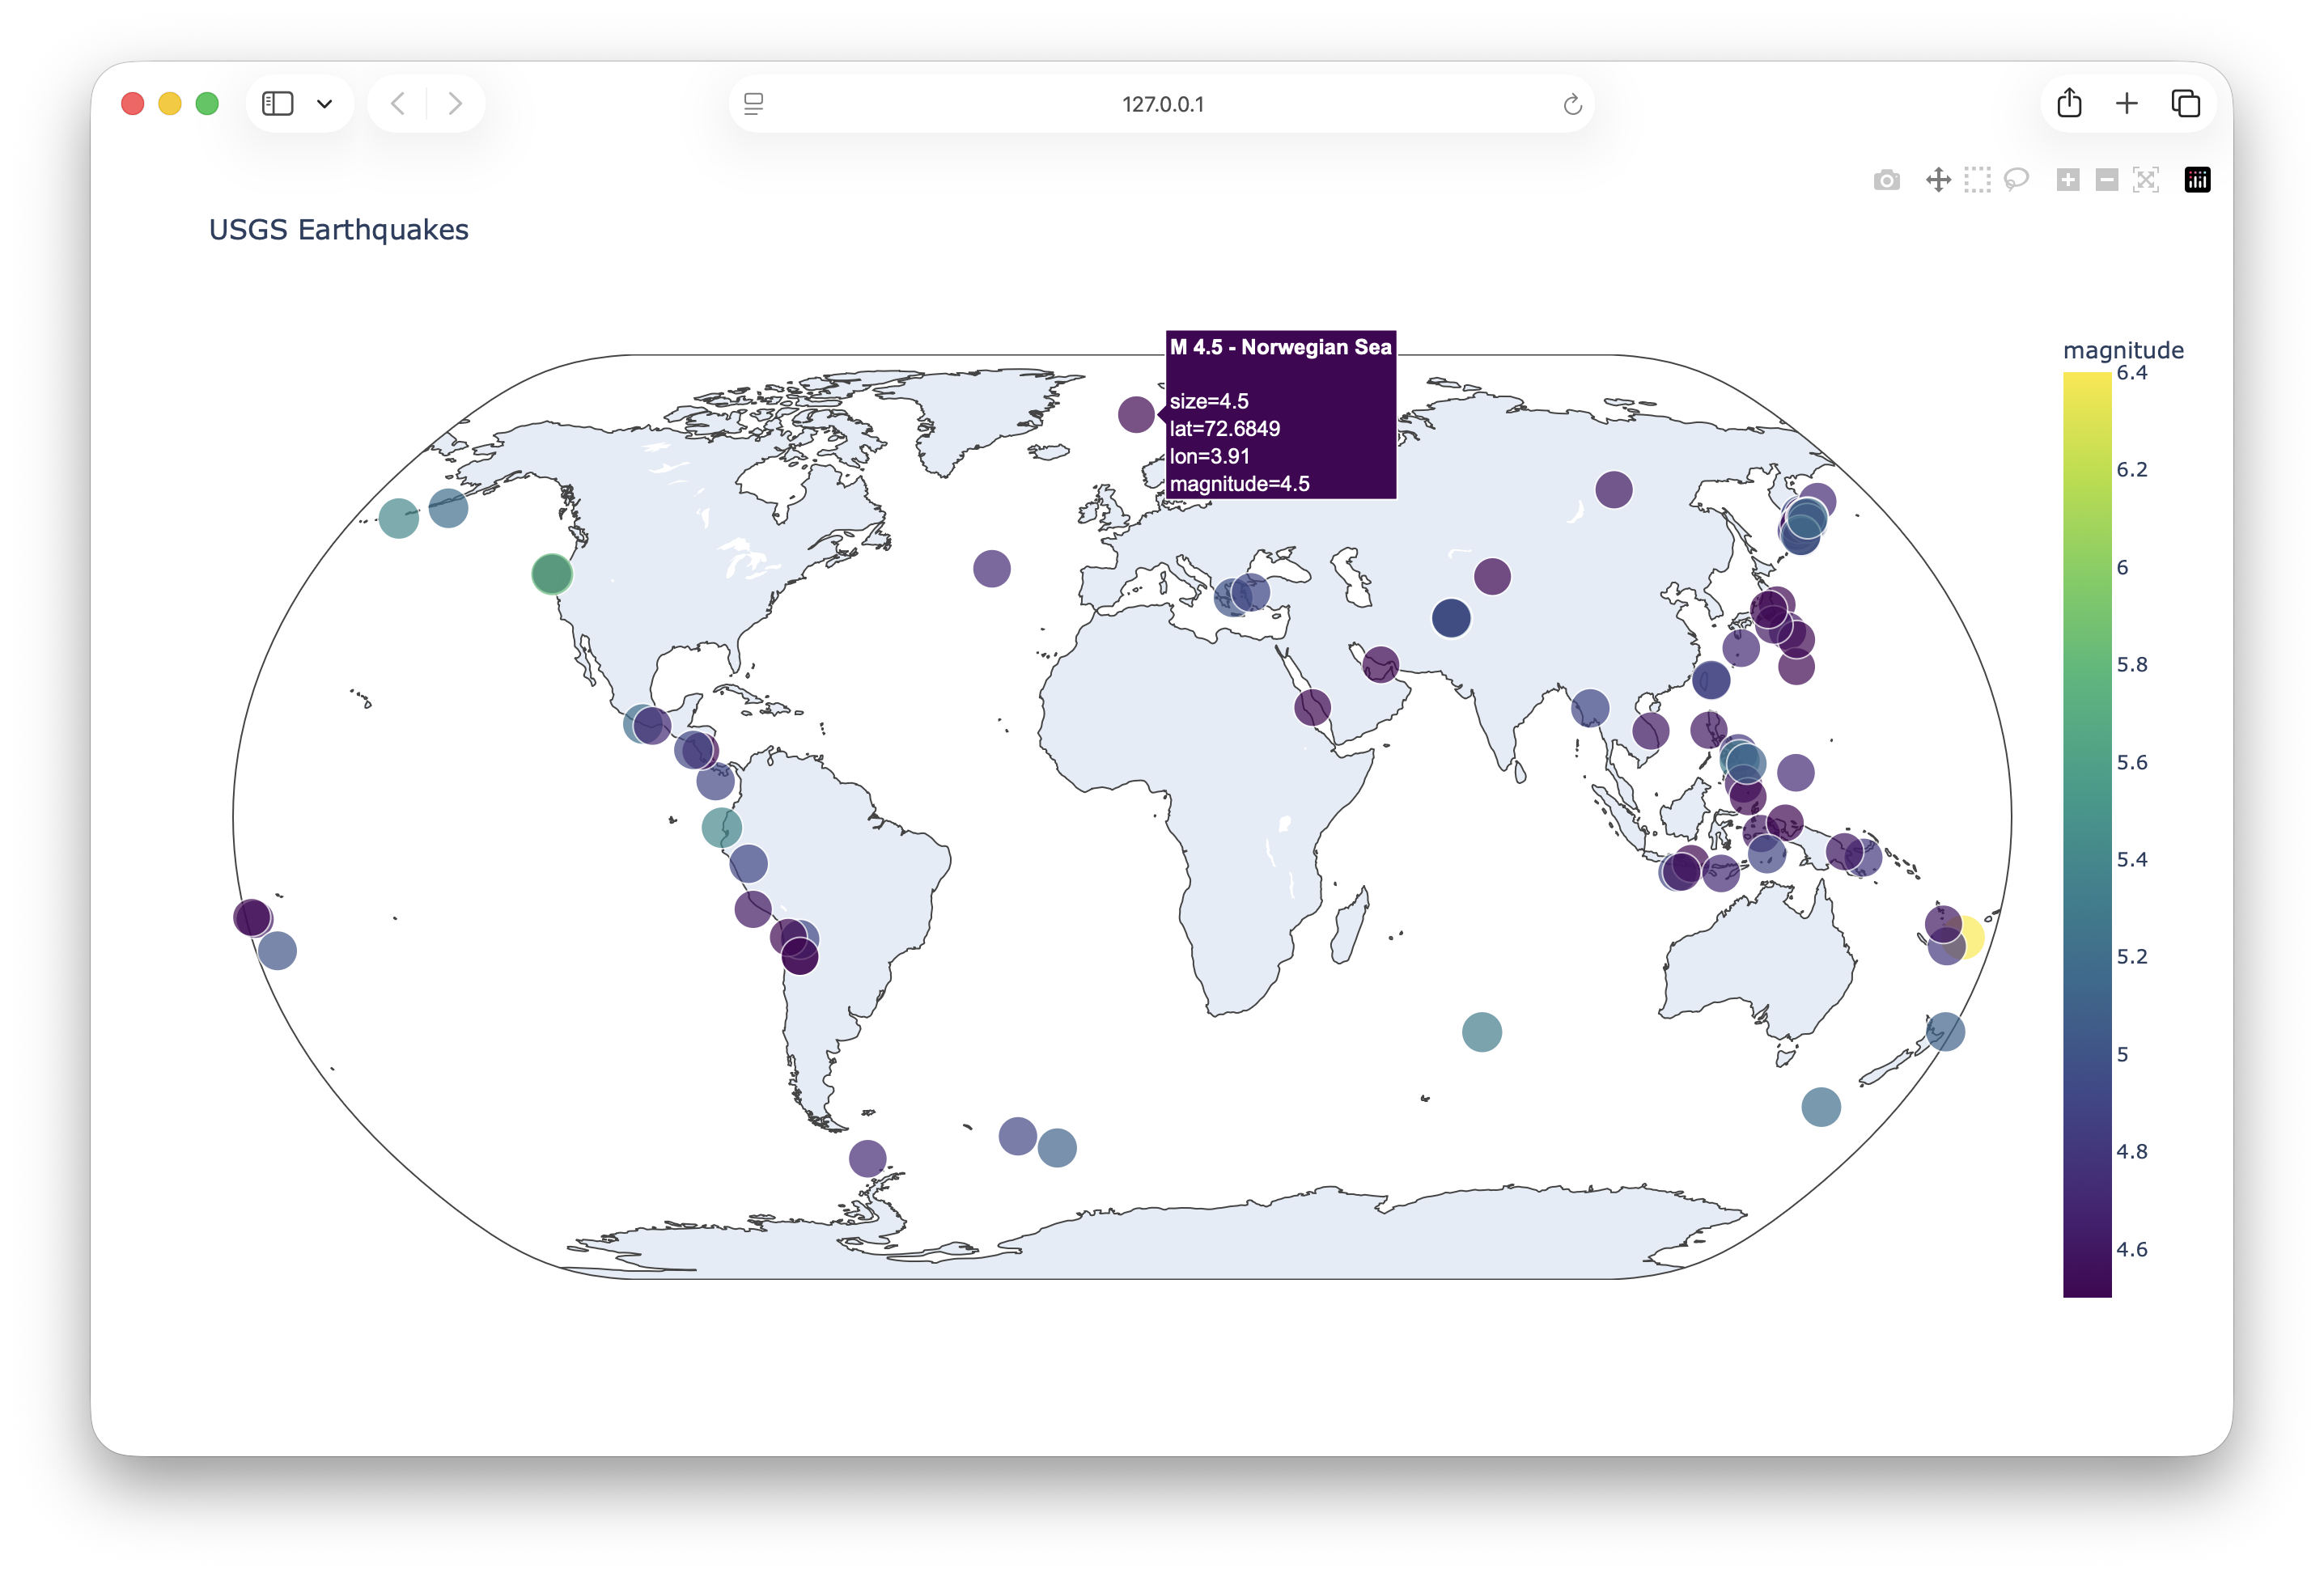
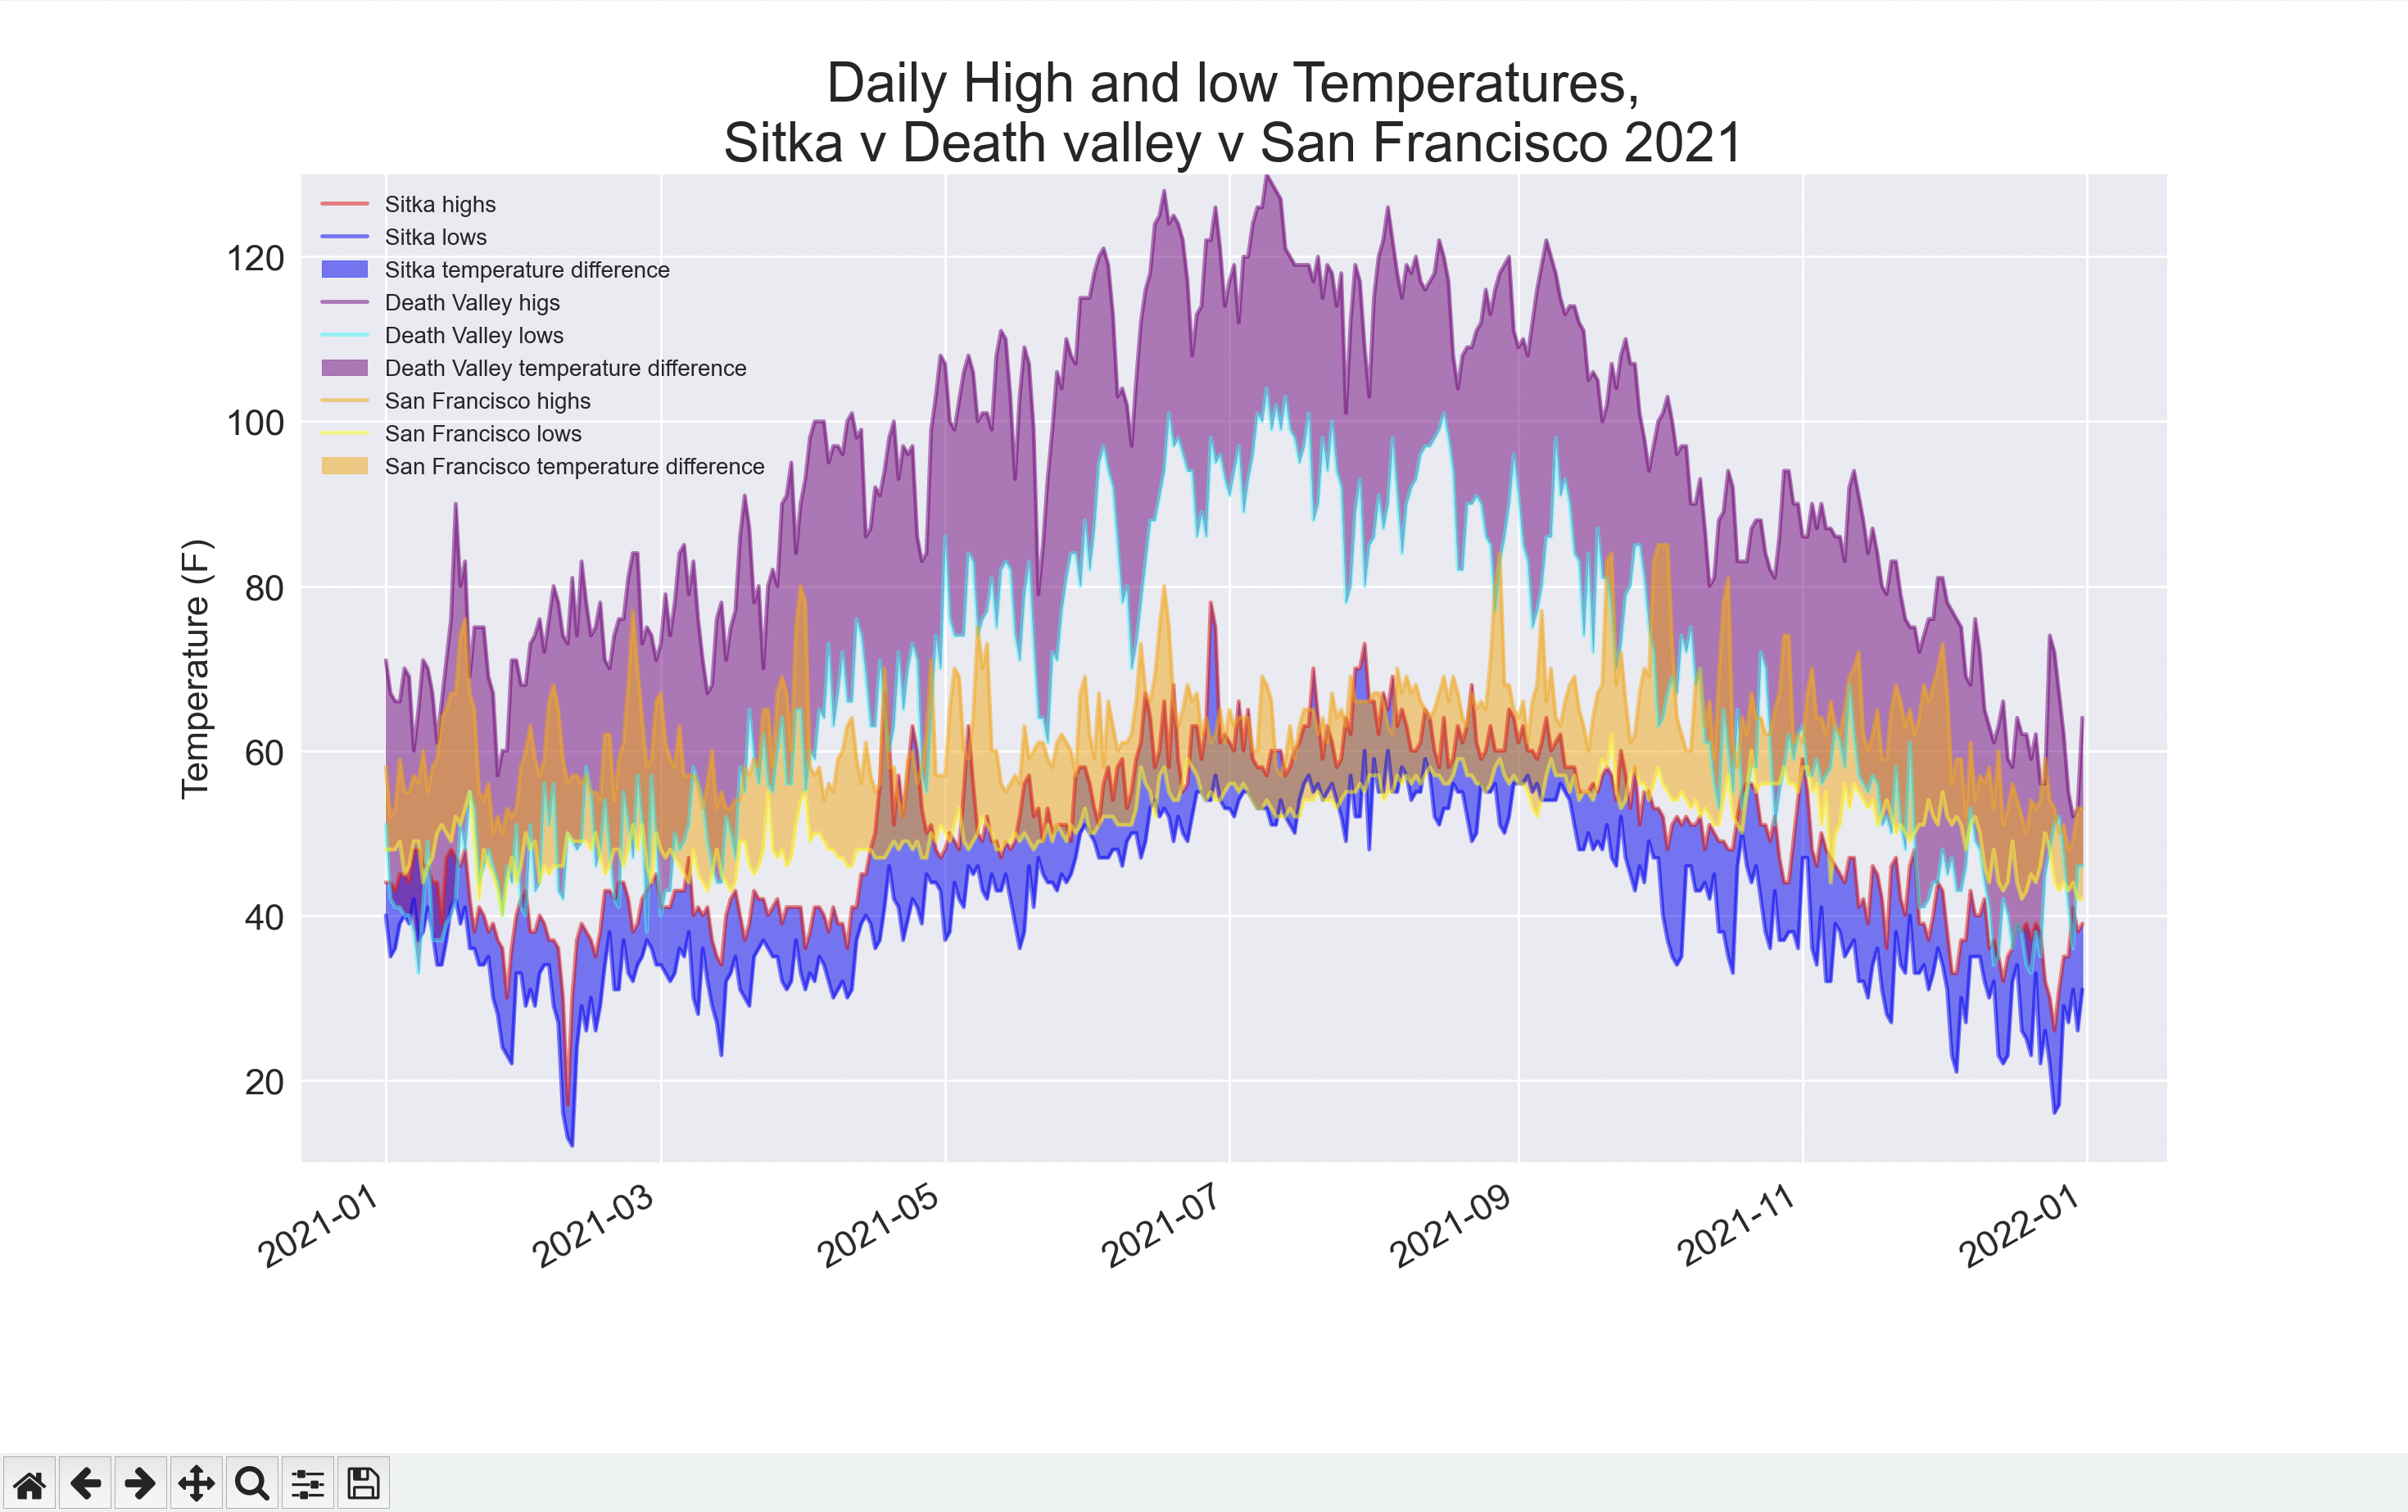
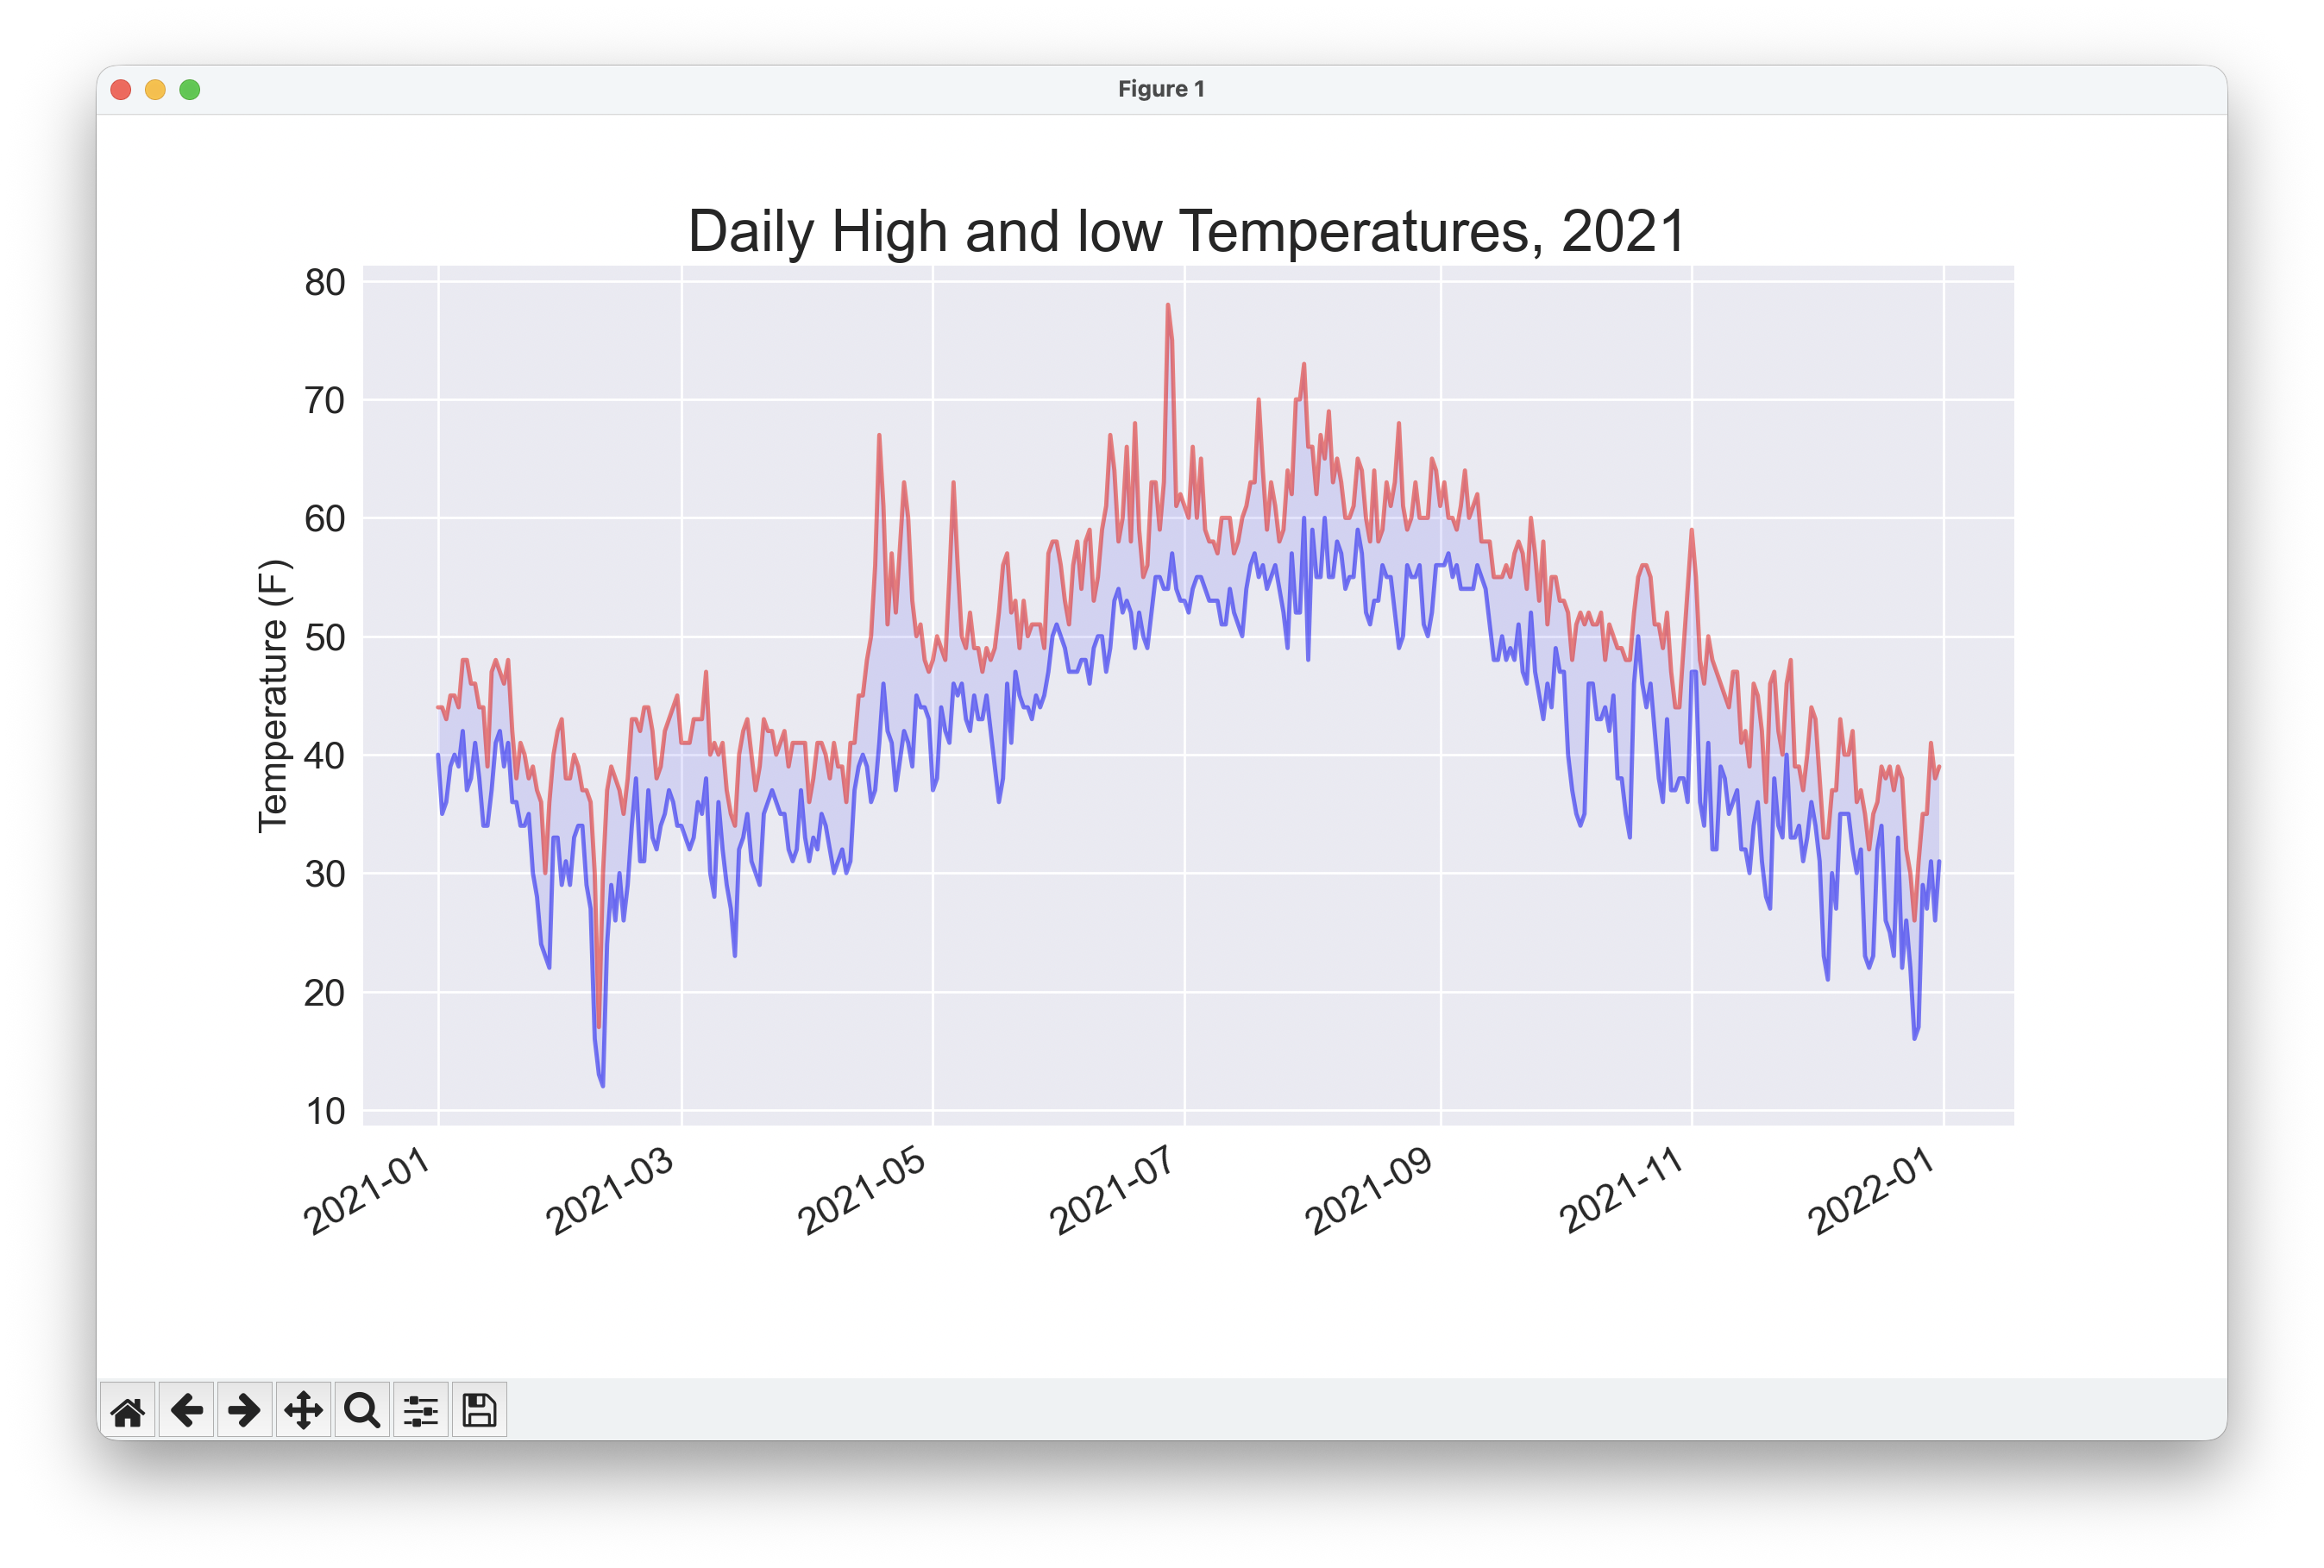
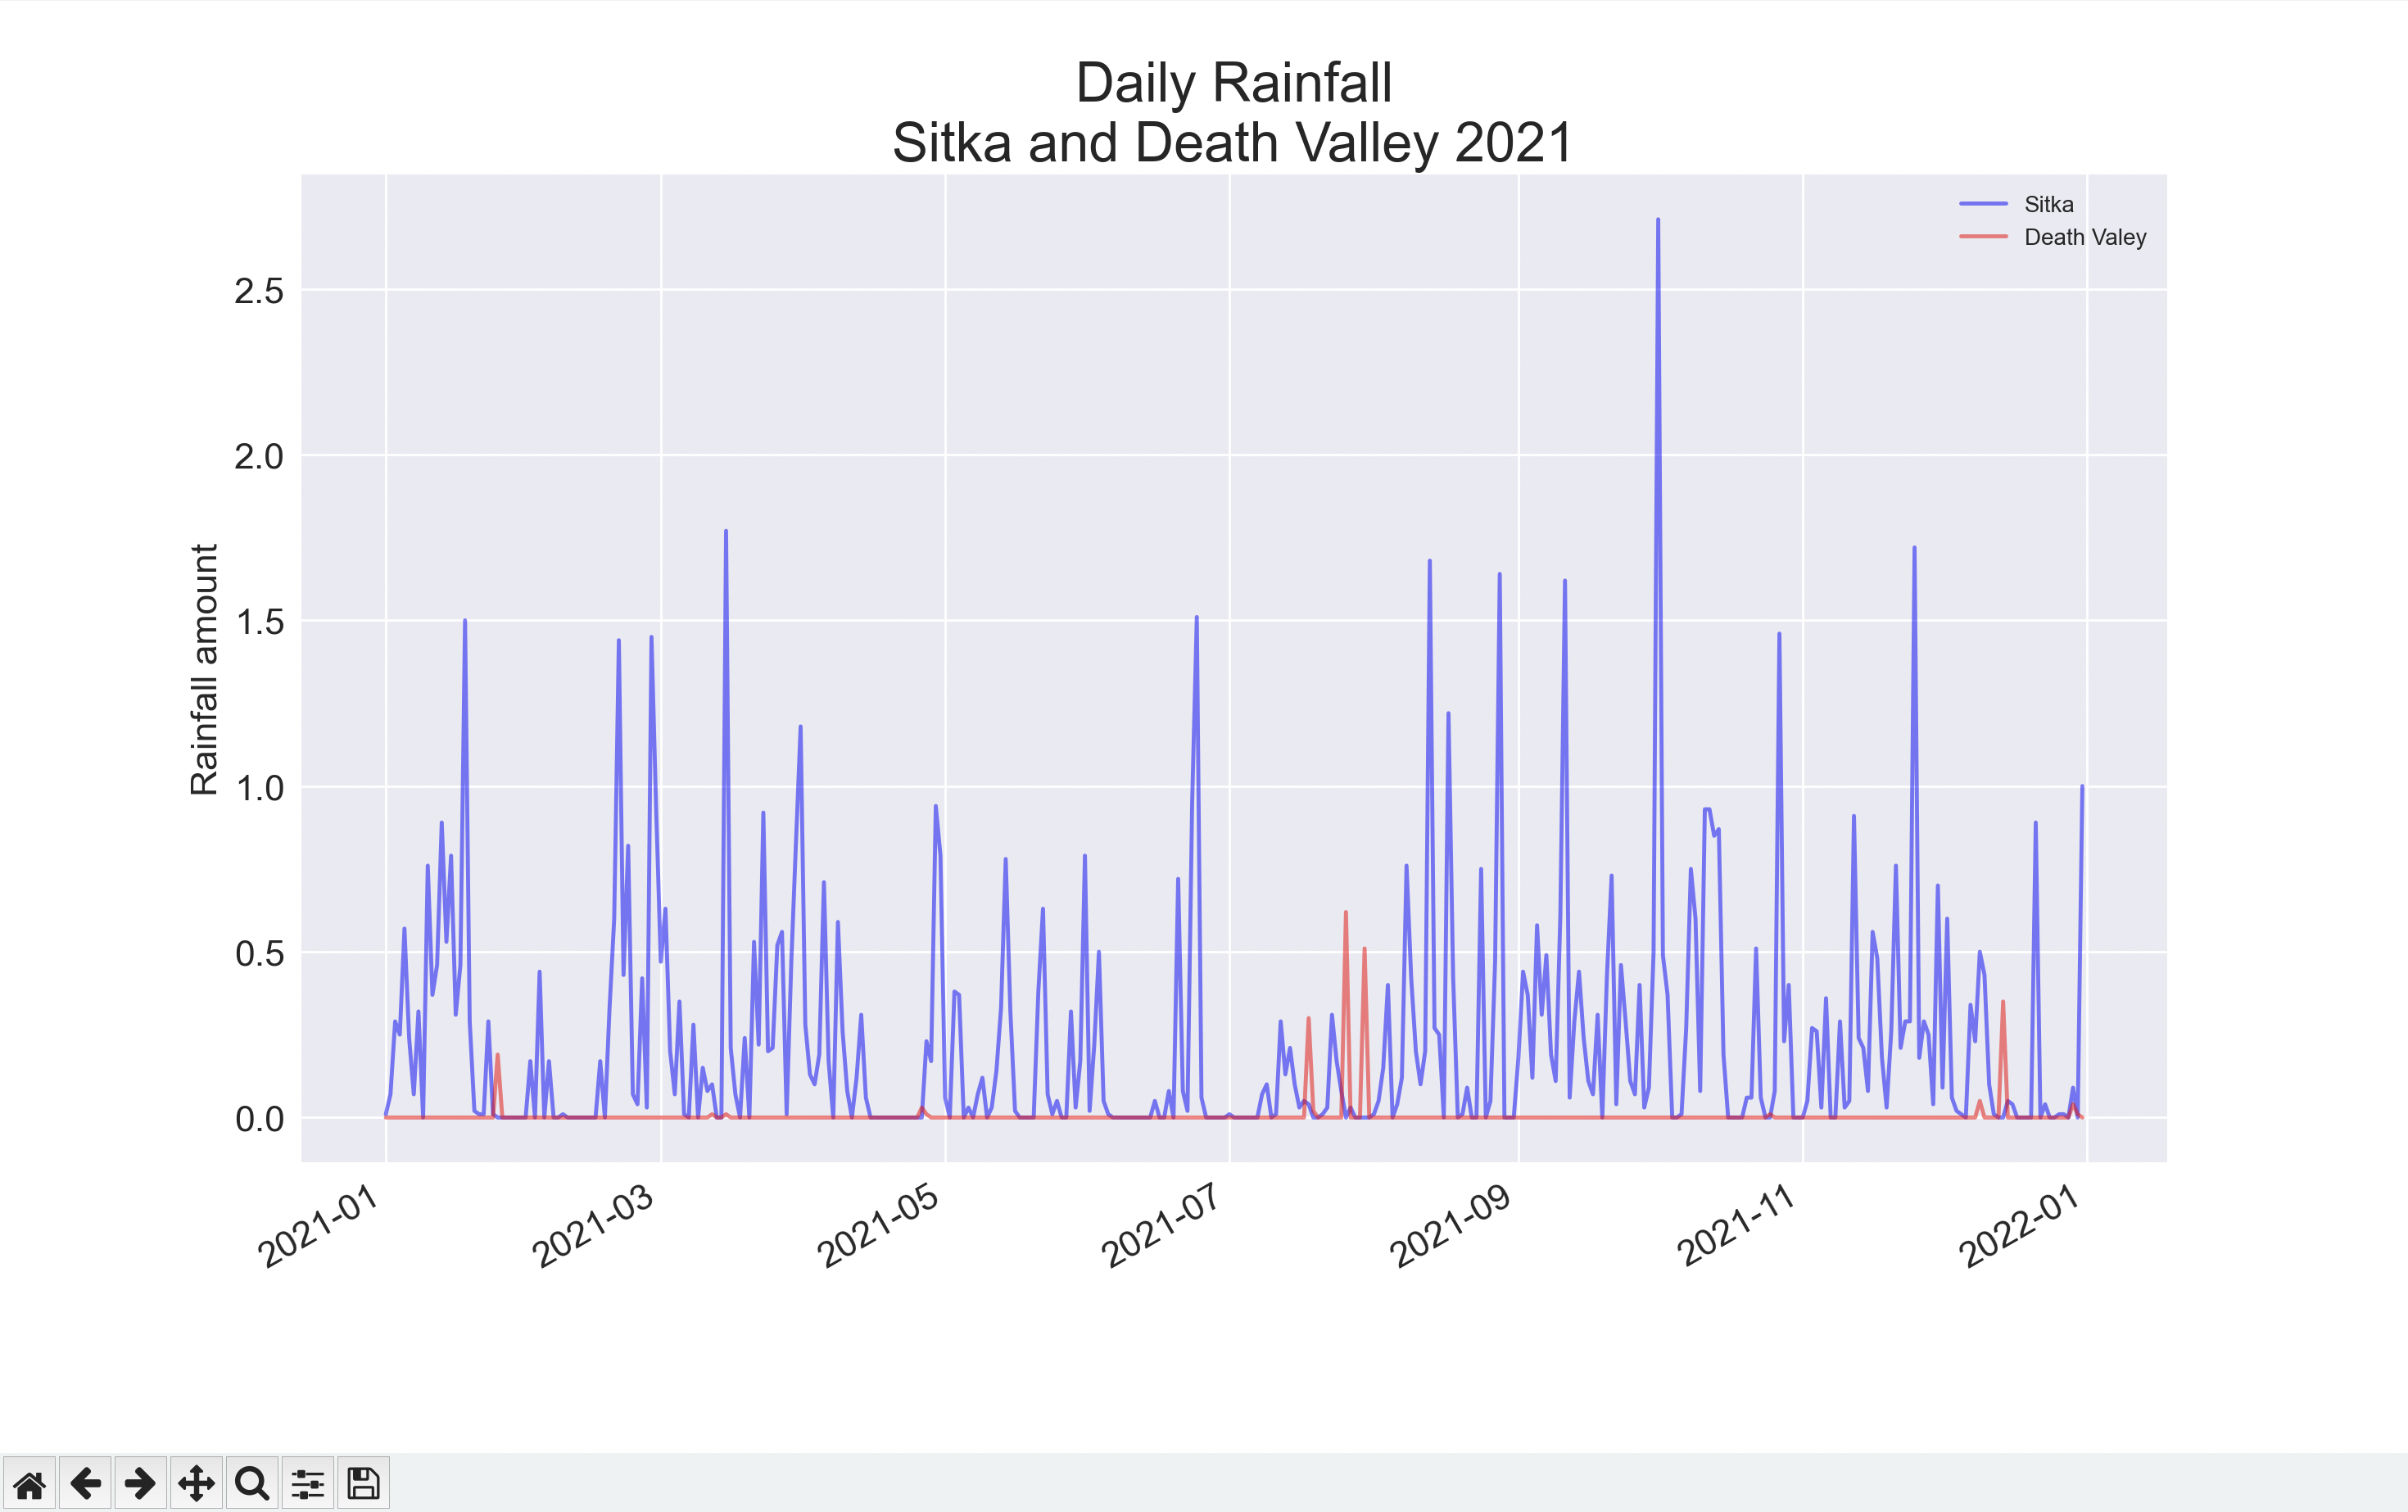
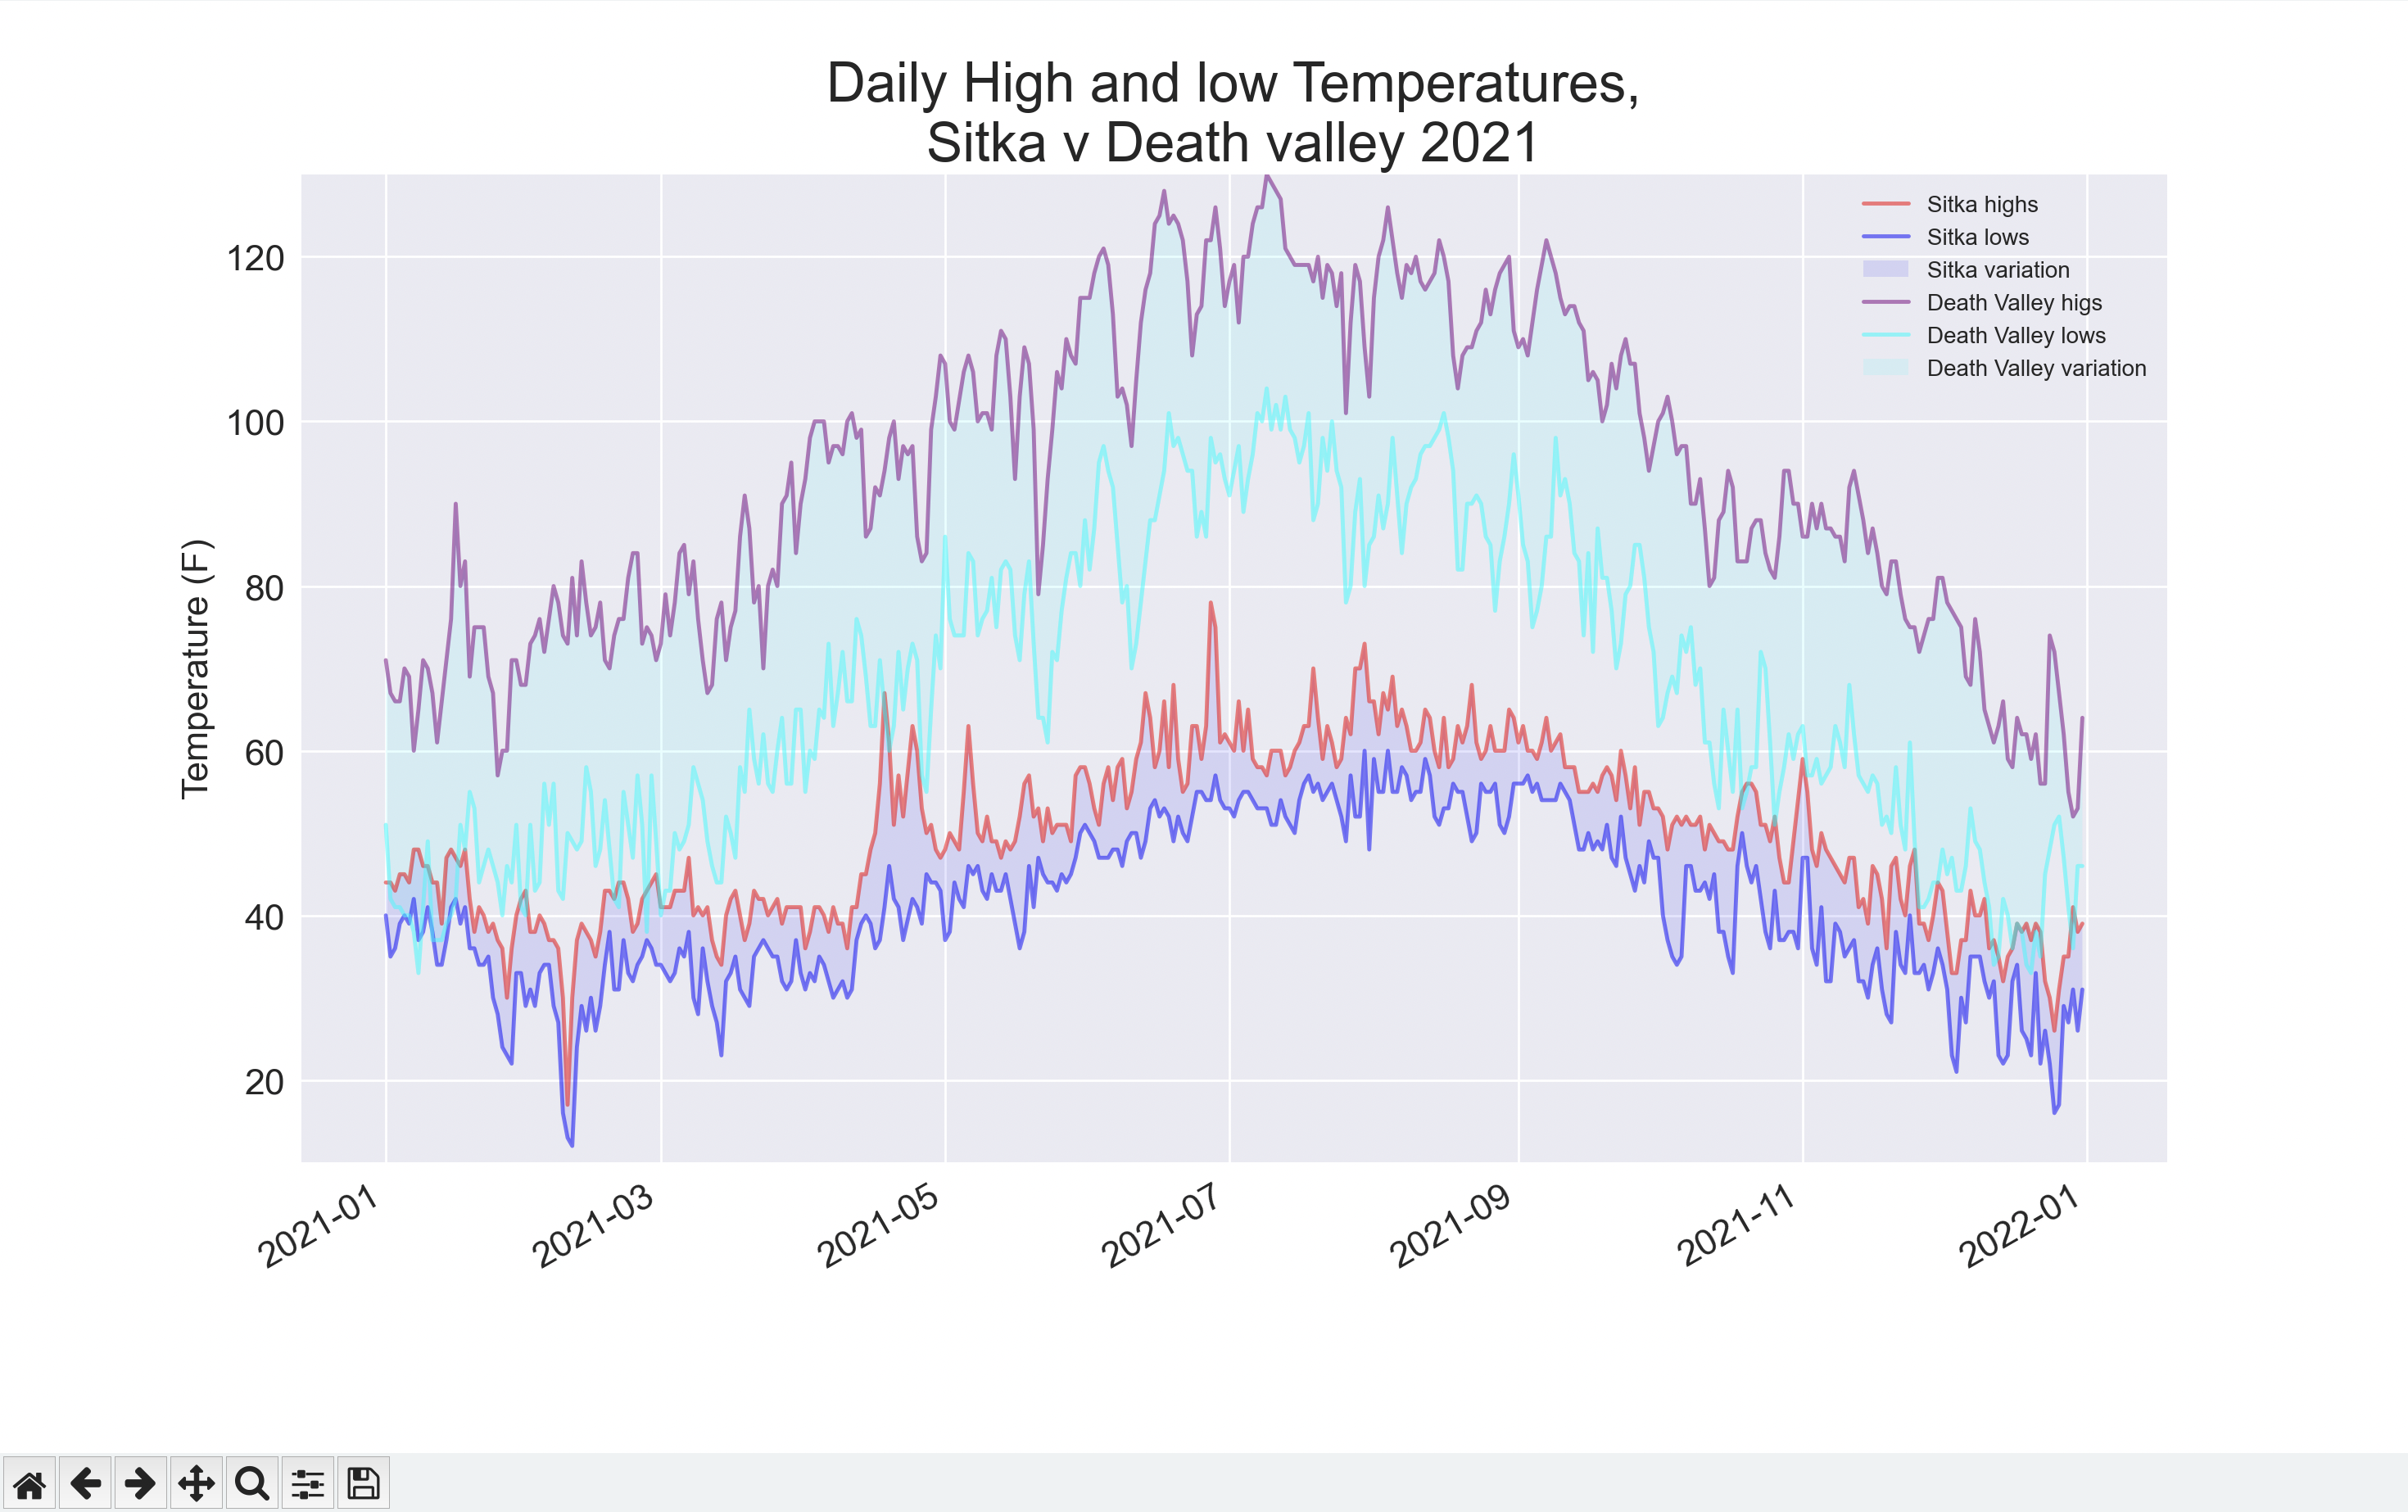
This project consists of several Python scripts that work with real-world datasets in CSV and GeoJSON format, including earthquake, wildfire, and weather data. The scripts handle data loading, basic cleaning, filtering, and structuring before generating visualizations using matplotlib and Plotly. The goal is to transform raw data into clear, readable charts — both static and interactive — to better understand trends and patterns.
Technologies:
Python, Matplotlib, Plotly